Elliott wave help us to understand the trend of the market. RBL Bank has continued to be showing strong up move over past few sessions. It has worked out well especially if you know how to apply Elliott wave along with simple technical indicator.
RBL Bank Hourly chart as on 18th July 2023 (Anticipated):
RBL Bank Hourly chart as on 18th July 2023 (Anticipated):

Wave analysis as on 18th July 2023:
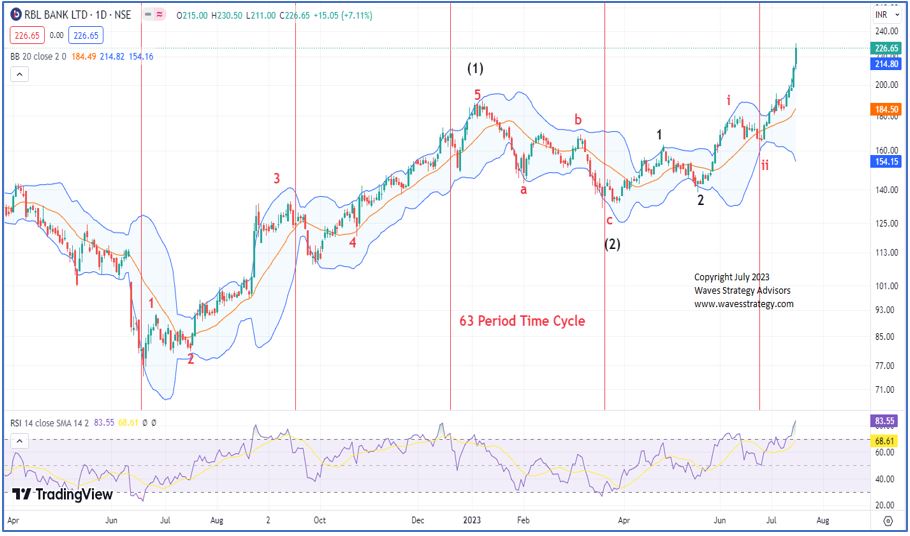
RBL Bank continued to rally just like its peer companies. Prices continued to close above previous day’s high. We have plotted 63 days’ Time cycle. In the above chart, we can see most of the lows are formed on our cycle and after almost every 63 period, RBL Bank has shown a positive reversal. Recently cycle turned on to buy side after breaking a swing high near 181 levels.
Stock is following simple Elliott wave pattern. Wave (2) got completed exactly near our cycle and since then stock is moving higher in form of wave (3). Primary wave (3) is subdividing in nature wherein, intermediate wave iii (red) is ongoing on the upside. In short, we expect stock to continue its bullish momentum.
In short, Trend for RBL Bank looks sideways to positive. One can use buy on dips approach with the targets of 250 levels with 200 as support.
RBL Bank 60 mins chart (Happened as on 28th July 2023)

We can see that Elliott wave count have helped us to find out the trend reversal for RBL Bank. As we expected after a dip, the stock has achieved our target of 250 levels and made high of 251.4. Stock has moved more than 16% from our buying levels within just 8 trading sessions. This up move we have been able to capture with the help of Elliott wave and simple price indicator.
Leave a Reply